
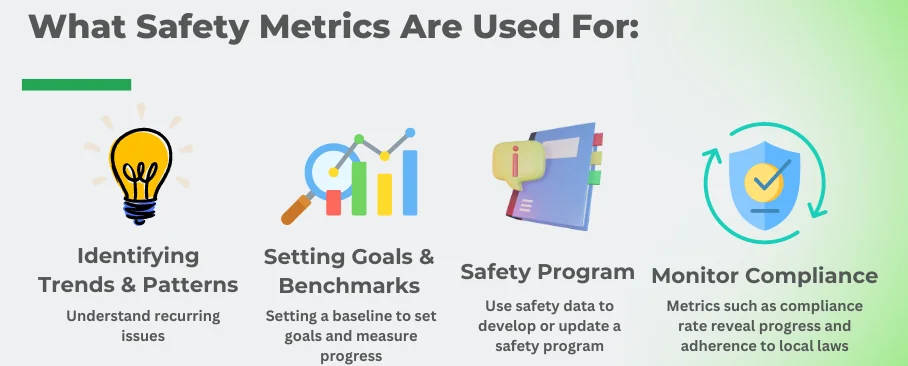
Safety metrics are the backbone of an effective health and safety program. They help organizations monitor their performance, identify areas for improvement, and ensure compliance with regulatory standards. This post covers the most critical safety metrics that every health and safety professional and risk manager should know. By understanding and tracking these metrics, you can create a safer workplace for everyone.
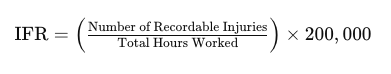
The Injury Frequency Rate (IFR) is a metric used to measure the number of work-related injuries relative to the total hours worked by employees.
To calculate IFR, first gather the total number of annual work-related injuries that are considered recordable according to OSHA regulations. Use that number and divide it by the total hours worked, then multiply by 200,000 (which is the OSHA standard base for 100 employees working 40 hours per week for 50 weeks).
Consider a construction firm recorded 8 injuries over the course of 400,000 total hours worked. Using the IFR formula, the calculation would be as follows:
IFR= [(8 / 400,000) * 200,000]= 4
This results in an IFR of 4, indicating that for every 200,000 hours worked at this facility, there were approximately 4 injuries reported.
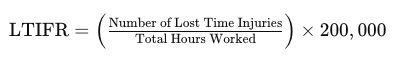
The LTIFR is a crucial metric that measures the number of lost time injuries per 100 employees over a specified period. It indicates the frequency of injuries that result in employees being unable to work. A Lost Time Injury (LTI) is an injury sustained by an employee that results in inability to work for at least one full shift following the day of the incident.
To calculate LTIR, divide the number of lost time injuries by the total hours worked, then multiply by 200,000 (which is the standard base for 100 employees working 40 hours per week for 50 weeks). A lower LTIR signifies better safety performance, highlighting the organization’s ability to prevent serious injuries.
If a manufacturing plant has five lost time injuries and employees worked a total of 500,000 hours during the year, the LTIR calculation would be:
LTIFR= [(5 / 500,000) * 200,000]= 2
This means there are 2 lost time injuries per 100 employees, which the safety team can use to assess their current safety programs.
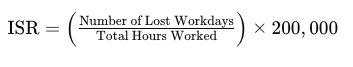
The Injury Severity Rate (ISR) measures the severity of injuries by accounting for the total number of days lost due to injuries or illnesses relative to the total hours worked.
To calculate ISR, first gather the total number of workdays lost due to work-related injuries during a specific period (i.e, yearly), then divide it by the total hours worked in that period and multiply that number by 200,000 (which is the standard base for 100 employees working 40 hours per week for 50 weeks)
Consider a construction company that experiences a total of 34 days lost due to injuries over the course of 600,000 total hours worked. Using the ISR formula, the calculation would be as follow
ISR= [(34 / 600,000) * 200,000]= 11.33
This means there are 11.33 lost workdays per 200,000 hours worked due to injuries.
The Total Recordable Incident Rate (TRIR) measures all recordable incidents, including those that result in injuries or illnesses requiring medical treatment beyond first aid. It’s a comprehensive metric providing an overview of the overall safety performance. It helps organizations identify patterns in incident occurrence.
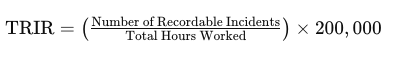
To calculate TRIR, divide the number of recordable incidents by the total hours worked, then multiply by 200,000 (which is the standard base for 100 employees working 40 hours per week for 50 weeks). A lower TRIR indicates fewer incidents and a safer workplace.
If a company has ten recordable incidents and employees worked a total of 800,000 hours, the TRIR calculation would be:
TRIR= [(10 / 800,000) * 200,000]= 2.5
This means that for every 100 employees working a total of 800,000 hours, there were approximately 2.5 recordalbe incidents during that year.
Near miss reporting involves documenting incidents that could have resulted in injury or damage but did not. It is a proactive measure to prevent future accidents by addressing potential hazards.
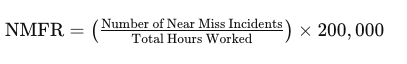
To calculate NMFR, first gather the total number of near miss incidents reported during the year and then apply it to the following formula:
Divide the number of recorded near miss incidents by the total hours worked, then multiply by 200,000 (which is the standard base for 100 employees working 40 hours per week for 50 weeks).
Suppose a company reports 15 near misses over the course of 1,000,000 hours worked. The NMFR calculation would be:
NMFR= [(15 / 1,000,000) * 200,000]= 3
This NMFR of 3 indicates that for every 100 employees working a total of 1,000,000 hours, there were approximately 3 near-miss incidents recorded during the assessment period.
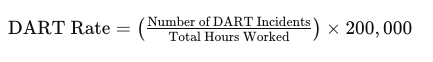
The DART rate measures the number of incidents resulting in employees being unable to perform their regular job duties due to injury or illness. These injuries or illnesses often result in days away from work, job restrictions or job transfers.
To calculate DART, first divide your total number of incidents that resulted in days away from work, restricted work activity, or job transfers (DART) by the total hours worked, then multiply by 200,000 (which is the standard base for 100 employees working 40 hours per week for 50 weeks). A lower DART rate indicates fewer severe incidents affecting employees’ ability to work.
For example, if a warehouse has 3 DART incidents and employees worked a total of 600,000 hours, the DART calculation would be:
DART= [(3 / 600,000) * 200,000]= 1
This means that the calculated DART rate of 1 in the example indicates that for every 100 employees working a total of 600,000 hours, there was approximately one incident that resulted in an employee being unable to perform their regular job duties due to injury or illness.
The First Aid Case Rate measures the frequency of work-related injuries that require first aid but do not involve more serious medical treatment. This metric helps track minor incidents that do not lead to lost time or restricted work but still indicate the need for safety improvements.
To calculate this rate, first gather the total number of work-related incidents that required first aid treatment but did not result in lost time or work restrictions. Then divide that number by the total hours worked by all employees during that period (i.e, early). Then multiply that number by 200,000 (which is the standard base for 100 employees working 40 hours per week for 50 weeks)
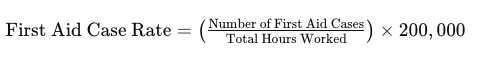
A company has 15 reported work-related injuries that resulted in first aid but no lost time or work restrictions. This was during a period of 500,000 hours worked.
First Aid Case Rate= [(15 / 500,000) * 200,000]= 6
The First Aid Case Rate is 6. This means there are 6 first aid cases per 200,000 hours worked.
The Safety Compliance Rate measures how well an organization adheres to safety regulations, policies, and procedures. It’s typically used to gauge the effectiveness of safety programs and identify areas for improvement.
First, define compliance criteria that might include safety trainings, adherence to safety procedures, or inspections of safety equipment, among others. Then gather data on compliance such as the total number of safety actions or checks completed (safety trainings, safety audits, etc) and total number of required safety actions or checks (# of required safety training sessions or scheduled inspections). Determine the rate by dividing the number of actions by the total number of required actions. Then, multiply the number by 100 which will convert the ratio into a percentage.
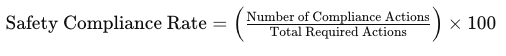
Assume a company has completed 45 safety training sessions out of the required 50 that were scheduled.
Safety Compliance Rate= (45 / 50) * 100= 90%
The Safety Compliance Rate is 90%, indicating that 90% of the required safety actions were completed.
Calculating the Safety Audit Findings Metric involves tracking the results of safety audits, including the number and types of findings, and using this data to measure and improve workplace safety.
First, classify your audit findings into categories, such as: minor issues (non-critical), major issues (significant issues that could lead to serious incidents), and critial issues (severe issues that pose an immediate threat to safety and require urgent attention). Afterward, calculate the total number of findings from those audits for a specific period of time. Next, calculate each category with the formula below:
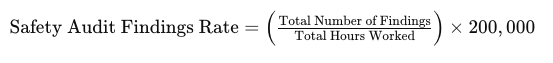
Consider a company that has the following audit numbers: 25 total findings (10 Minor, 10 Major, 5 Critical). The total number of hours worked in the specified period is 500,000.
Safety Audit Findings Rate= (25 / 500,000) * 200,000= 10
The Total Safety Audit Findings Rate is 10 findings per 200,000 hours worked.
Minor Findings Rate= (10 / 500,000) * 200,000= 4 minor findings per 200,000 hours worked
Major Findings Rate= (10 / 500,000) * 200,000= 4 major findings per 200,000 hours worked
Critical Findings Rate= (5 / 500,000) * 200,000= 2 critical findings per 200,000 hours worked
In summary, safety metrics are critical tools for organizations striving to enhance workplace safety and protect employee well-being. Tracking these metrics consistently allows companies to identify potential hazards, evaluate the effectiveness of safety programs, and make informed adjustments to their practices. By prioritizing safety metrics, organizations not only foster a culture of safety but also demonstrate their commitment to employee health, ultimately leading to higher productivity and reduced costs associated with injuries and absences. A proactive approach to monitoring these metrics is essential for creating a safer work environment and ensuring sustainable business operations.